
MacKenzie Gore’s Spring Struggles- Cause for Concern?
MacKenzie Gore of the Texas Rangers- Smiley N Pool DMN Staff
MacKenzie Gore posted a 12.79 ERA in his first three spring starts as a Texas Ranger. In six innings. The hot takes were immediate. Rangers fans had reason to worry. The national baseball media had a ready-made narrative about a reclamation project gone wrong before the calendar flipped to April.
Stop. Put down the ERA.
After four years of tracking spring training data against actual regular season results, one thing is clear: spring ERA is one of the least predictive numbers in baseball. Across 13 pitcher-seasons of Rangers starters with matched spring and regular season data, the average gap between spring ERA and regular season ERA is 2.29 runs. ERA gets the direction right barely more than half the time.
There is, however, another metric.
The question worth asking about MacKenzie Gore is why he only struck out three batters in 6.1 innings.
THE ERA MYTH, PROVEN
The table below covers every Rangers rotation starter with at least one season of matched spring training and regular season data from 2023 to 2025. ERA gaps above 1.50 in either direction are highlighted.
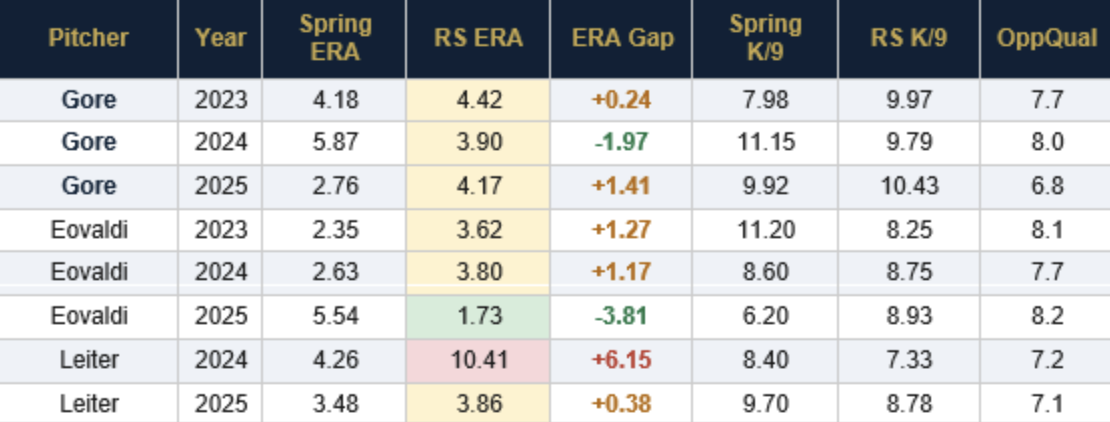
SPRING ERA VS. REGULAR SEASON ERA — TEXAS RANGERS STARTERS, 2023-2025
The patterns are hard to miss. Nathan Eovaldi posted a 5.54 spring ERA in 2025 against an opponent quality rating of 8.2, which was among the toughest competition in the dataset. The beat writers filed their decline narratives. He went on to pitch to a 1.73 ERA in the regular season, his best full-season mark ever, finishing with 4.3 bWAR. His FIP was 2.80. His xFIP was 3.03. The spring ERA was noise.
Jack Leiter's 2024 tells the opposite story. His spring ERA was 4.26. It was not alarming, but it was not clean. He proceeded to post a 10.41 ERA in 23.1 regular season innings and was eventually sent back to AAA Round Rock. His spring K/9 of 8.40 was actually the early warning sign, sitting below his 2025 spring mark of 9.70, a year in which he took a clear step forward at 3.86 ERA.
Cody Bradford's 2023 spring ERA was 3.00, which is fine. He then posted a 6.95 ERA in 33.2 innings. His 2024 spring ERA was 4.95, concerning on its face. He responded with a 3.03 ERA in 74.1 innings, his best professional showing to that point; he would have been a mainstay in the Ranger rotation except for a season-ending elbow injury.
We have already concluded that ERA in spring training is noise when it comes to some kind of predictive ability for the regular season. Small sample size and questionable defense of non-roster invitees contribute to this.
The pattern holds across the dataset. Spring ERA in 13 to 20 innings is a sample so small that a single bad outing can inflate it by two or three runs. A good outing against a lineup full of non-roster invitees can deflate it just as easily. It tells you almost nothing about what a pitcher will do over 30 starts and 160 innings.
THE K/9 SIGNAL
Strip away ERA and something more useful emerges. Strikeout rate in spring training tracks closer to regular season performance than ERA does. The average K/9 gap across this dataset is 1.34, versus 2.29 for ERA. It is still imperfect, but it is meaningfully more stable.
The reason is mechanical. Strikeout rate reflects stuff and command. A pitcher either has the ability to miss bats or he does not. That does not change dramatically between March and April. ERA, by contrast, is contaminated by defense behind the pitcher, by sequencing luck, by BABIP variation, by the roster composition of spring training lineups. It is a context-dependent result stat. K/9 is a direct measure of what the pitcher himself is doing.
This brings us back to Gore.
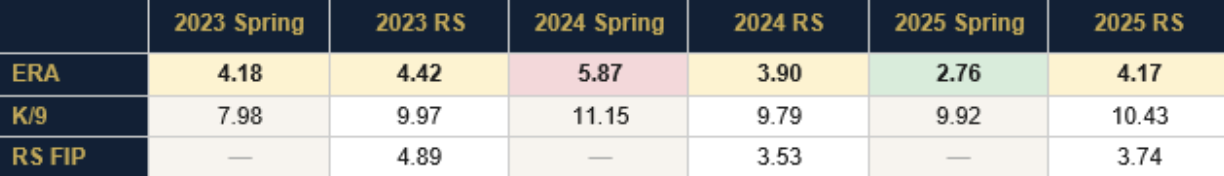
MACKENZIE GORE SPRING TRAINING VS. REGULAR SEASON, 2023-2025
Three years in D.C. Spring K/9 of 7.98, 11.15, and 9.92. Regular season K/9 of 9.97, 9.79, and 10.43. The spring numbers are noisier; that 11.15 in 2024 is an outlier driven by a small sample, but the range is consistent. This is a pitcher whose stuff generates strikeouts at a rate near 10 per nine innings. That is who MacKenzie has been, reliably, for three years.
His 2026 spring K/9 is 4.26.
That is not simply a bad spring. That is a different pitcher.
WHAT SPRING 2026 NUMBERS ACTUALLY SHOW
Here is Gore's full four-year spring training profile, with the 2026 numbers given proper context.
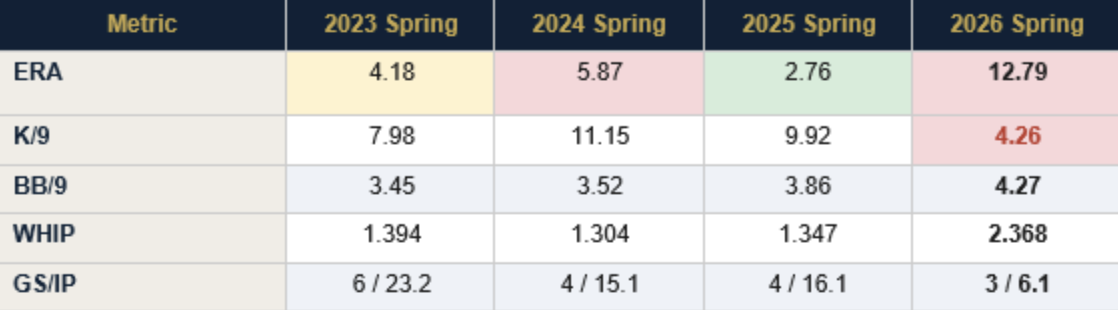
MACKENZIE GORE, FOUR-YEAR SPRING TRAINING PROFILE
The ERA number is eye-catching, but it is the K/9 that stands apart. In 2024, he posted 11.15 K/9 in spring. In 2025, 9.92. Those numbers came against opponents rated 8.0 and 6.8 respectively. In 2026, against a 7.8 OppQual, which is solid competition, he has three strikeouts in 6.1 innings.
A 5.42 decline in K/9 from his three-year spring average is not a blip. The walk rate is slightly elevated, but not alarming. The WHIP is ugly, and 12 hits in 6.1 innings is genuinely bad. But those outcomes flow from one underlying cause: hitters are making contact. The bat-missing ability that defined Gore's entire career appears to have gone somewhere.
Let’s go back to the 4.26 K/9 for this spring. There is some argument about the defense behind him, of course. What that argument does not cover is his ability to miss bats. There is also the question, that is glaring, in his start numbers. 6 games started in spring, with less than 2 weeks to go before the start of the season. That is max 2 more games started. There has been no mention as to some kind of slower ramp-up for the season.
The most natural explanation is velocity. Gore's regular season fastball averaged 95.1 mph in 2023, 96.1 in 2024, and 95.3 in 2025. A meaningful drop from that range, down to 92 or 93, would explain every other number in the 2026 spring line. Spring training is often where velocity dips show up first, because pitchers are building arm strength and not all of them arrive at full throttle on the same schedule. That data is not yet publicly available for 2026.
Which means we do not have a definitive answer. What we have are three possibilities. One: his velocity is down and this is a legitimate red flag about his stuff heading into the season. Two: this is a mechanical issue, something changed in his delivery working with a new coaching staff, and it was corrected before opening day. Three: 6.1 innings of spring training is a sample too small to mean anything, and the pitcher who struck out 10.43 batters per nine innings in 2025 shows up when the games count.
The 2025 regular season offers a useful counterpoint on this last option. Gore went 5-15 with a 4.17 ERA at Washington; a rough-looking line. His FIP was 3.74. His xFIP was 3.78. Both were career bests. His K-BB% of 17.8% was his highest ever. He was pitching better than his record suggested, with a Nationals team that ranked near the bottom of the league in run support and defense. Was the ERA hiding something real?
The 2026 spring ERA may be doing the same thing in reverse, hiding a problem that the K/9 is surfacing plainly.
THE NUMBER TO WATCH
When Gore takes the mound for Texas in April, the number that will tell you whether this spring was signal or noise is strikeout rate.
If he is generating misses, and the K/9 climbs back toward nine or ten in his first handful of outings, then spring was an aberration. A mechanical adjustment, a slow arm buildup, a function of facing a new spring training schedule in a new organization. The underlying pitcher is still there.
If the K/9 stays depressed, if he is inducing soft contact but not missing bats, then the velocity question becomes urgent. Something changed between his last start in Washington and his first start in Texas, and the K rate will scream it from the rooftops.
MacKenzie Gore signed with the Rangers to be a legitimate rotation piece on a team trying to climb back toward contention. He pitched to a sub-4.00 FIP last year, in more than 150 innings, while losing 15 games. The underlying talent is documented. The concern is real. The verdict requires more data.
Spring ERA is a lie. What it is hiding this time is the only question worth asking.
METHODOLOGY NOTE
Analysis covers Texas Rangers and Washington Nationals starters appearing in both spring training and regular season data from 2023 to 2026. Spring training data sourced from Baseball-Reference Grapefruit/Cactus League leaderboards with opponent quality ratings applied. Regular season data from FanGraphs standard and advanced pitching leaderboards. OppQual represents the average MLB win percentage of opponents faced in spring training, scaled 1-10. Only pitchers with at least 5 spring innings and 10 regular season innings were included in comparative analysis.
About the Author
The Baseball Nerd launched in early 2025 with a simple philosophy: stories based on numbers, not feelings. Combining proprietary metrics like the SPARK Score (for identifying breakout candidates) and the FADE Score (for predicting regression) with accessible storytelling, he serves both serious sabermetrics enthusiasts and casual fans looking to understand the game at a deeper level. His Sunday Stories explore baseball history through approachable narratives, exploring the personal side of baseball with historical and lost stories; while his in-season coverage focuses on the Texas Rangers. You can find his work at The Baseball Nerd, where analytics meet narrative in a way that makes the numbers come alive.