
25 Percent Done: Four Honest Verdicts on the 2026 Texas Rangers
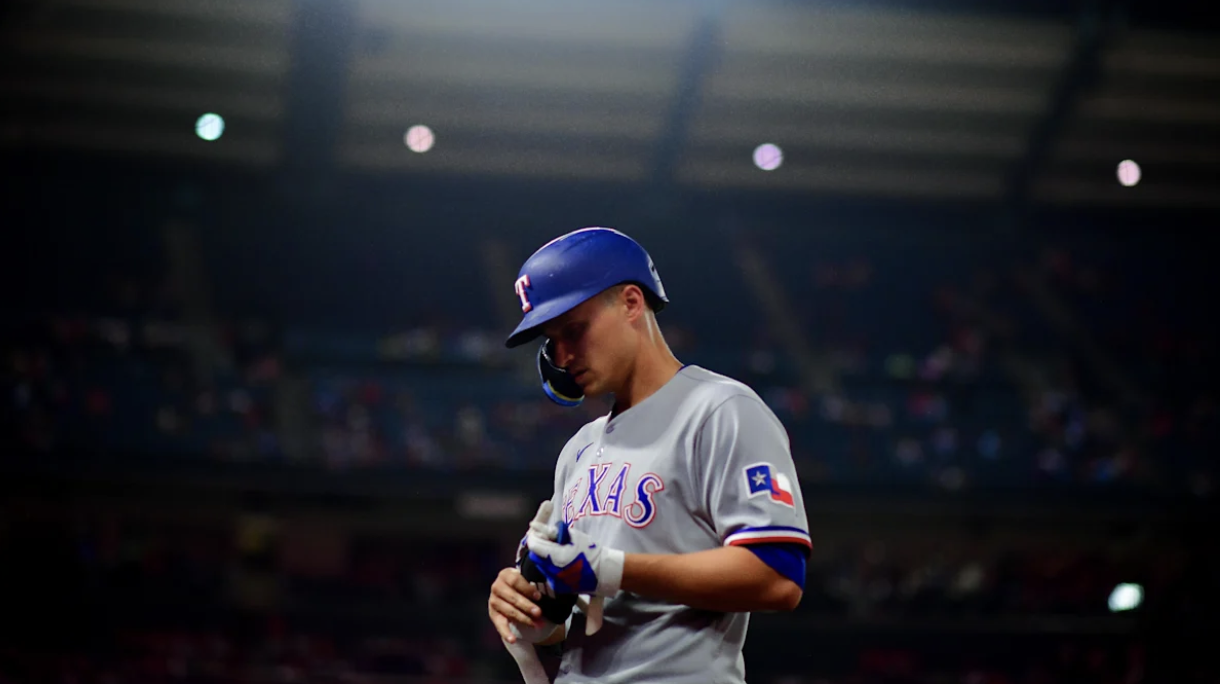
Texas Rangers shortstop Corey Seager Gary A. Vasquez-Imagn Images
Forty games. 19-21. A quarter of the season in the books.
If you came here looking for reassurance, you are in the wrong place. If you came here looking for an honest assessment, pull up a chair.
While the 2026 Texas Rangers are not a bad baseball team. They are also not a good one. They are something more uncomfortable: a team talented enough to hang around, not disciplined enough to pull away, and flawed in ways that the schedule will not allow to stay hidden much longer. At the 25 percent mark, that is not speculation. That is a documented pattern with 40 games of evidence behind it.
Here are four honest verdicts.
Verdict 1: The Offense Is Failing at the Worst Possible Moments
This is the central story of the first 40 games, and the numbers are not subtle about it.
The Rangers are hitting .234/.316/.370 as a team, a .686 OPS against a league average of .718. Their Rbat+ of 106 says they are slightly above average overall, which sounds fine until you look at where that production disappears.
The team's RE24, runs added above average based on base-out state, sits at -20.39. That number reflects the cumulative damage of 40 games of failure with runners in scoring position. Not only is Texas leaving men on base, the offense is consistently leaving them on base in the exact situations that separate winning teams from .475 teams.
The wRC+ picture at the individual level tells the same story with more precision. Josh Jung is having a legitimate breakout at 168 wRC+, slashing .331/.382/.525 with a .403 rOBA that leads the club by a wide margin. Brandon Nimmo has been a legitimate table-setter at 131 wRC+. Ezequiel Duran has produced real value at 139 wRC+ in a utility role. Those three have carried this offense.
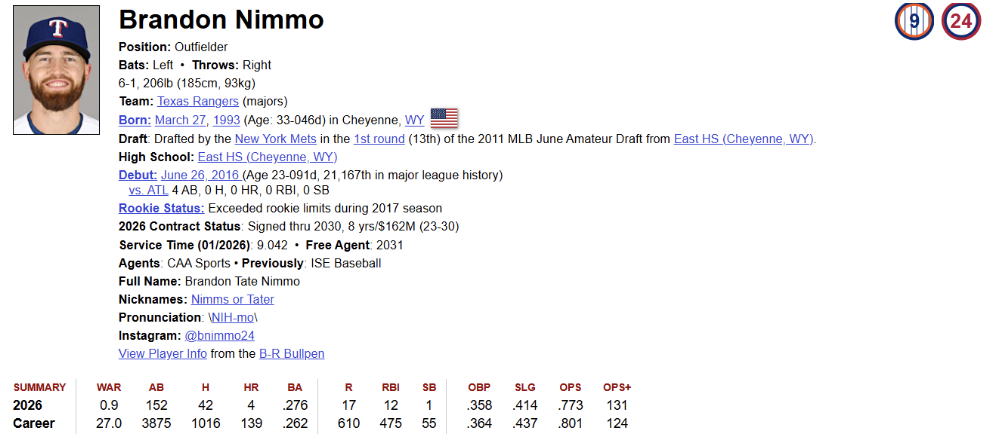
Brandon Nimmo Profile (Baseball Reference)
Everyone else is underwater. Corey Seager sits at 99 wRC+, essentially league average, hitting .193/.300/.379. Jake Burger is at 79 wRC+ with a .208 average and a .242 OBP that creates constant outs. Danny Jansen is at 87 wRC+ and has been one of the worst baserunners on the roster. The team's WPA sits at -1.7. Over 40 games, this lineup has been a net negative in win probability added.
The baserunning data adds another layer. Texas has a team XBT% of 33 percent against a league average of 43 percent. They are not taking extra bases. They are not creating pressure on the basepaths. The team scores 3.8 runs per game, below the league average of 4.4. When you combine below-average run creation with a -20.39 RE24, you get a team that manufactures just enough offense to keep games close and not quite enough to win them consistently.
Wyatt Langford on the IL removes one of the few legitimate run-creators from the equation. His absence is not an excuse. It is a multiplier on a problem that was already present before he went down.
Verdict 2: The Rotation Has a Two-Starter Problem
Jacob deGrom and Nathan Eovaldi are the clear top of this rotation. Everything behind them is a liability the Rangers have not yet been forced to fully pay for, but the bill is coming.
deGrom has been as good as advertised when healthy. Through eight starts: 44.2 IP, 2.62 ERA, 2.85 FIP, 0.918 WHIP, 32.8 K%, 4.6 BB%. His RE24 of +9.22 leads all Rangers pitchers by a significant margin. Opponents are hitting .199/.236/.343 against him. His 1.4 WAR through a quarter of the season is an ace-level number. The concern with deGrom is never the performance. It is his durability, and at 38 years old, every start he completes healthy is something the Rangers cannot take for granted.
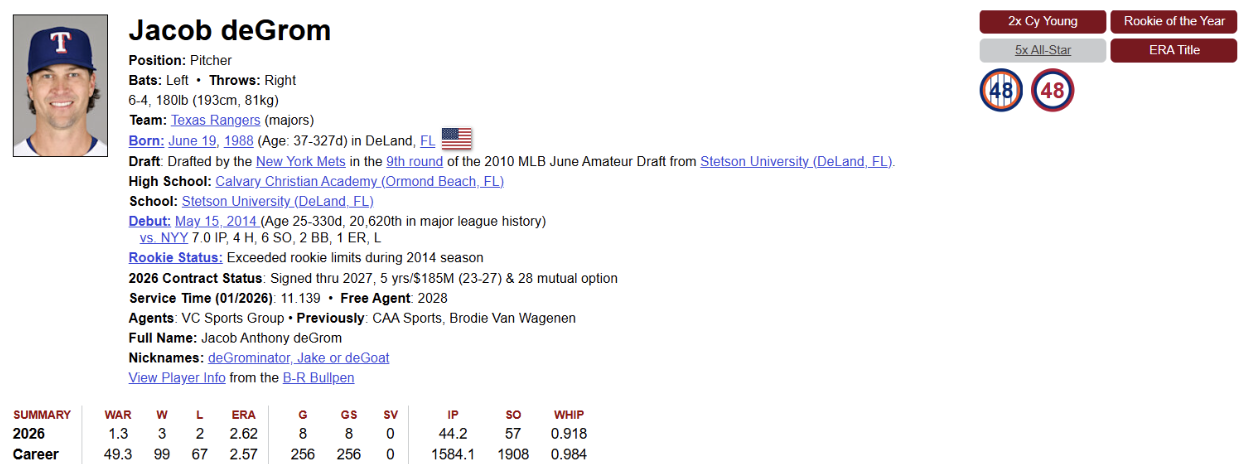
Jacob deGrom Profile (Baseball Reference)
Eovaldi has been reliable without being dominant. His 4.15 ERA sits above a 4.69 FIP, which suggests some fortune working in his favor. His 5.0 HR/9 rate is a real problem against power lineups. He has also had three outings where he topped 100 pitches. But he has eaten innings and given the bullpen rest, and in the context of what the back of this rotation looks like, that has genuine value. His last start in the Bronx was classic Eovaldi, throwing through 8 innings and racking up 8 strikeouts, allowing only one run.
Then there is the other rotation.
Kumar Rocker is 1-4, 5.01 ERA, 1.515 WHIP in seven starts. His K% is 18.6 percent, below average for a starter and far below where it needs to be for a pitcher who was supposed to profile as a power arm. His 53.8 GB% creates constant traffic. Four wild pitches in 32.1 innings reflect the command issues the box score glosses over. His opponents' BABIP is .320, meaning batters are making consistent contact when they do connect. There is no strand rate luck propping up a misleading number. Rocker is simply not pitching well enough right now.
MacKenzie Gore is 2-3, 5.18 ERA, 3.99 FIP. That FIP gap is meaningful, and it suggests some bad luck. But a 4.7 BB/9 rate and one quality start in eight outings is not a sequencing problem. It is a command problem. He has left eight base-out situations where relievers inherited runners, creating downstream bullpen strain in games where he was the nominal starter.
Jack Leiter has a 4.85 ERA and a 4.36 FIP. His 9.6 BB% is the second-highest on the staff. He has the swing-and-miss stuff with a 26.2 K%, but the walks undermine everything. His RE24 of -3.02 reflects the cumulative cost of consistently putting runners on base and handing the problem to someone else.
The rotation's team QS% is 28 percent against a league average of 32 percent. The Rangers are getting quality starts at a below-average rate, and when starters exit early, the bullpen is being asked to cover innings it was not built to cover.
Verdict 3: The Bullpen Is Holding, But the Seams Are Showing
The aggregate bullpen numbers look better than the rotation. Jacob Latz has been exceptional: 0.87 ERA, 0.435 WHIP, opponents hitting .074/.125/.147. He has been arguably the team's best pitcher through 40 games. Jakob Junis has been quietly excellent at 1.65 ERA with a .417 OPS allowed. Jalen Beeks and Tyler Alexander have both been functional in middle-inning roles.
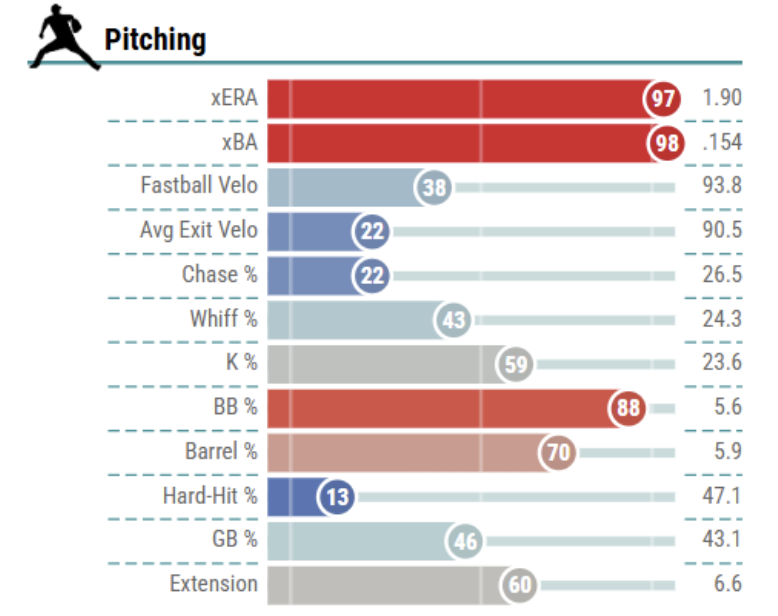
Jacob Latz 2026 Pitching Metrics (Baseball Savant)
The seams appear in the high-leverage work.
Chris Martin is on the IL with a 7.11 ERA and a 1.057 OPS allowed. Cole Winn has a 4.80 ERA and negative WAR. Cal Quantrill has allowed 9 runs in 13.1 innings. Robert Garcia and Luis Curvelo are both on the IL, with Curvelo allowing a 1.014 OPS in his brief appearances. The team has blown four saves in 40 games.
The Rangers carry a team ERA of 3.65, buoyed by deGrom and the better relief arms. Their 3.99 FIP suggests that number will climb. The staff has allowed 44 home runs in 349.2 innings, a 1.1 HR/9 rate that has contributed directly to several of the late-inning collapses that define this first quarter of the season. The bullpen's depth problem is real. Latz and Junis cannot carry the high-leverage load indefinitely, and Martin and Garcia's return timelines remain uncertain.
Verdict 4: The Rangers Are Not Maximizing ABS
This is the least discussed story of the first 40 games, but it connects directly to the team's run production problem.
The ABS challenge system gives every team a fixed number of challenges per game. Teams that deploy them strategically generate real, measurable value at the margins. The Rangers have not been one of those teams.
Texas catchers have thrown 28 challenges this season and overturned 16, a 57.1 percent overturn rate. That rate sounds acceptable until you look at what the model expected. The Rangers were projected to overturn at a 51.8 percent clip based on the pitches they challenged. Overperforming by roughly six percentage points is a positive. But the more damaging number is on the other side: opposing catchers have challenged Texas pitchers 28 times and overturned 15 of them, a 53.6 percent rate against an expected 34.0 percent. That means opposing catchers are dramatically outperforming expectations when they challenge Rangers pitchers, flipping one strikeout and one walk in the process.
The team's total_vs_expected from the catching data is -10.27. That is a net negative. The Rangers are getting some value from their own challenges but giving back significantly more through the challenges thrown against their pitchers. In a system designed to reward teams who are disciplined and strategic, Texas is currently on the wrong side of the ledger.
The batter-side data reinforces the problem. Corey Seager has thrown six challenges, overturned four, but his total_vs_expected is -2.56, meaning the challenges he has made and the ones thrown against him have combined to hurt his run expectancy. Evan Carter has a -2.42 total_vs_expected with only a 33.3 percent overturn rate on three challenges. Josh Jung is at -1.07 despite two overturns in five challenges. Josh Smith is at -1.19 with zero overturns in three challenges. The most positive batter-side performers are Nimmo (+4.21) and McCutchen (+1.24), both of whom have been selective and successful.
The best example of disciplined ABS usage came April 12 at Dodger Stadium, when Danny Jansen overturned four of five challenges in deGrom's start, directly supporting his command line in a game the Rangers needed. That kind of situationally aware deployment is what the system rewards. Forty games in, that game remains an outlier rather than a pattern.
In a lineup already running a -20.39 RE24, leaving pitch calls on the table in key counts compounds an existing problem. The margins this team is operating within are thin enough that ABS challenge efficiency is a competitive lever, not an administrative footnote. Right now, Texas is on the wrong side of it.
The Honest Summary
The 2026 Rangers are a 19-21 team that plays like one. The record is not bad luck. Jung, Nimmo, and Duran are doing legitimate work. deGrom is pitching like a top-five starter when he takes the mound. Latz and Junis have been genuine pleasant surprises. Those things are true and they matter.
What is also true: this lineup cannot execute with runners in scoring position at a league-average rate, and the RE24 proves it. The back three of the rotation have a combined ERA over 5.00. The bullpen depth is thinner than the headline ERA suggests. The team's approach to strategic leverage, including ABS, has been inconsistent.
There are 122 games left. The AL West has not run away. This team has time.
But the first 40 games have been an honest audition. The Rangers are a team waiting for something to click. The numbers say it has not happened yet, and at 25 percent of the season complete, waiting is no longer a strategy.
Pete Dwyer covers the Texas Rangers for Painting Corners and is the founder of The Baseball Nerd Media Ventures. Statistics through May 10, 2026 via FanGraphs and Baseball Reference.