
WHIP, FIP, Hooray!

Josh Sborz, Taj Bradley, Reid Detmers, Kodai Senga (MLB.com)
Here’s the scenario: I’m sitting in the recliner next to my father-in-law on a Sunday afternoon. We’re checking our fantasy lineups to see who’s doing better and who has a close match-up. My father-in-law looks up, and asks, “you know how I pick up a great pitcher? WHIP.” As far as pitcher stats go, I’d give K/9 and BB/9 a quick eye-scan on TV to gauge if our due-up could rally against our opponent’s call to the bullpen, but I’d mostly grown up on a simple, staple diet of ERA and wins vs. losses. WHIP felt like another abbreviation for a fraction that probably started with “walk”; I just didn’t know or care how to make it click. Fast forward to fantasy baseball against your father-in-law, plus you write for a baseball blog – it was time to expand my pitching lexicon.
Scanning fantasy free-agents based on WHIP alone can get you pretty far, points-wise, and the interesting part is how those (lack of negative) points translate to a pitcher’s measurable but hidden success. Plainly, the mythos of the MoneyBallers seems to me the alluring promise of the court alchemists claiming to turn lead into gold – unearthing the Shea Hillenbrands from the scrap heap to spit out a budget-friendly pennant. In a way, that’s the same impulse of American industrialism (or fantasy baseball): how to turn the thing that nobody knows about yet into windfall profits. When big names like Gerrit Cole and Spencer Strider go first in a fantasy draft, WHIP is that slightly lesser-known stat that, at a glance, shows you the lesser-known arms that are good at limiting damage.
WHIP is: Walks + Hits / Innings Pitched. WHIP measures how often a batter gets on base, and getting on base is the measure of a good offense. In What’s wOBA, we revealed some nuance to this tautology: it’s not just getting on base (OBP) or how well you balance that while slugging the ball (OPS) – the greatest measure of a hitter’s success is the type and scenario of offense they produce, relative to the given offensive outcomes across the entire league over a time sample. What? Indeed. Go read What’s wOBA.
For pitchers, adding in nuance means only factoring in the things they can control (I’m imagining Shota Imanaga saying the Serenity Prayer when he takes the mound). For things a pitcher can and can’t control – how can we tell the difference? Player defense can be noise that drowns out the song of a pitcher’s stat sheet — in either regard. A pitcher can control strikeouts, walks, and hits, for the most part — but not defense. WHIP and ERA are both imperfect at this, while ERA is even more clunky. ERA tells you how many runs a hitter gives up per 9 innings, but it doesn’t tell you that the pitcher walked 2 batters prior to giving up a home run (the order of events), nor does it fairly account for relief pitchers letting your base-runners cross the plate while you sit helplessly from the dugout steps. Determining if a run is earned or not is subjective, while WHIP tries to isolate things to just measure base runners.
Yet, WHIP is another one of those, good-but-still-missing-part-of-the-story statistics. 2022 NL Cy Young winner, Blake Snell, offers a perfect case study; graded on WHIP alone (1.20 in 2022) he’s no longer Cy Young caliber. Snell struck his way out of bases loaded situations a lot of the time, but some luck — or at least defense — was involved. Strand rate helps you look good even with a high WHIP, but strand rate isn’t just impacted by strikeouts. A howitzer in center field like Andruw Jones or a catcher like Pudge throwing out base stealers can get you out of a jam just as well.
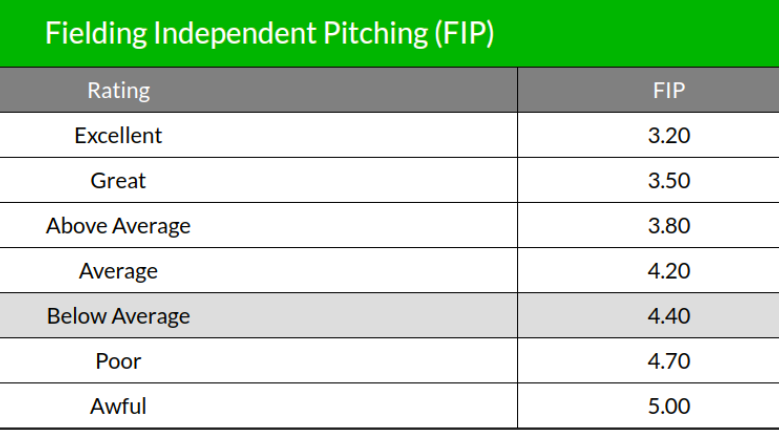
Enter FIP: Fielding Independent Pitching. What’s special about FIP is you can be lucky with strand rate but not with FIP; it’s a one-stop shop for evaluating Cy Young-type stuff at a glance without WHIP’s caveats. Poor WHIP with Blake Snell doesn’t tell the strikeout story, and low WHIP could be burying the gold gloves behind you in your headline, still. WHIP is mostly the pitcher, FIP is only the pitcher. FIP is a less noisy and more pitcher-precise WHIP. It’s the wOBA of pitching. We needed wOBA to contextualize hitters (remember how OPS over-valued strikeout-prone sluggers nestled in a nice spot in the batting order) – we need FIP for the same reason on the mound. Further, WHIP treats walks and hits equally, ignoring the impact of singles and home runs (remember how SLG over-valued certain hits, but OBP, for its part in the OPS equation, treated all hits the same?). How does FIP “clear the mechanism” and show us only the pitcher’s impact on their success?

FIP is taking the rate of things a pitcher can control – homers, walks, strikeouts – and adding a constant value to warp it into looking like ERA. When you read a guy’s FIP, think of it as Chef Carmy in Hulu’s The Bear telling you your homemade beef bolognese is good, instead of a coworker trying to be polite at a potluck. It carries weight. Here’s an insert from Fangraph’s to get the currency exchange rate:
“Weight” brings up the topic discussed in wOBA – and which will be a common theme of Sabermetrics Baseball discussion: how do we get the numbers of the knobs (weights) in each equation? In FIP’s case, where did we get the 13, 3, and 2 from? Weights are derived from the loss function of a multivariate linear regression equation – they are the rates of change (descriptions of the relationship) between home runs, walks, and strikeouts with regards to runs allowed, where both the dependent variable (runs allowed) and its independent variables (home runs, walks, strikeout) are normalized by 9 innings (every value is divided by 9). In short, exempting the ERA-ish constant we apply at the end, FIP is the rate of runs scored due to walks, home runs, and strikeout, per inning.
If you’re curious, there’s some math up ahead where I’ll break down how we get the weights. For now, FIP is these three steps:
Get a dataset where each row is a pitcher, and each column is their Runs Allowed (R), Home Runs (HR), Walks (BB), Strikeouts (K), and Innings Pitched (IP).
Normalize each value by dividing it by 9 innings (so relievers and different work loads are apples to apples).
Fit the values to a regression model (a best fit line)
This is the tricky bit. One can fit a regression line to data with Excel or Python, or get down and do the math themselves. The important point is this: fitting a regression line means minimizing the sum of squared errors between the actual runs allowed and the predicted runs allowed. Say the line we plotted of all the pitcher data was a big squiggle constellation of dots. The regression line would be a line that tries to hug and describe that squiggle as best it can, considering all the data points. Further, we want that line to hug that squiggle in a way that isn’t just the squiggle itself, but in a manner that can be predictive. It’s of no use to us being able to look down on a wet sidewalk and say we’ve predicted rain.
Back to the FIP equation weights: with regards to each of the independent variables, HR, BB, K, what is their coefficient in the equation that creates that line of best fit? What impact do each of those pitching outcomes have in determining our squiggle-fitting line? If your periphery’s already flinched at the non-ASCII, Greek B’s below, I feel you. Here’s what I’ll leave you with as a take-away: FIP is better than WHIP because it measures the pitcher only, and while WHIP is better than ERA, FIP does one better by looking like ERA. Lastly, the weights in the FIP equation are like turning dials in your car stereo on a road trip. Your kid just passed you the the AUX cable after listening to bass-heavy Hip Hop, and you’re trying to put on a podcast where you can hear the voice crystal clear: you want the bass turned a little lower so it doesn’t blow your speakers (K), you want the treble turned down a little, but not too much (BB), and you’ll turn the middle up, since that’s the vocal range of the podcaster’s voice you really want to break out of the sound bands. It checks out with FIP: pitchers that give up bombs should be heard loud and clear as poor performers, but should gain a bit back (suffer smaller penalties) when they strikeout a lot of batters.
—————
If you want to keep going, I’m going to put the equation here, and thanks for sticking around. Don’t worry about the weird looking “B”. It’s just an arbitrarily-chosen Greek letter that needn’t be intimidating. The “B0” is the intercept and the “B1-3” are the weights of each variable:

We get those weights with the below equation, also known as the equation for gradient descent.

Pretend for a second it doesn’t look like math: the equation is really just saying, “for every actual data point we have, how far is it away from the best-fit line?”. You take the sum of the squares of those differences (to cancel out negative values from data points being below the best-fit line), and finally, divide it by the total number of data samples. With that equation, you’re essentially plotting a new graph, a single U-shaped curve, describing how much your best-fit line doesn’t exactly hug the original squiggle of data. We use that curve, then, taking the partial derivative of it with respect to each independent variable (“B1-3”), to figure out how to minimize how wrong we are. This is why it’s called gradient descent: we are finding how steeply we minimize our “wrongness” by nudging each variable (HR, BB, K) down the “U” of our “wrongness” function. In other words, we calculate the rate of change for each variable with respect to the loss function, so we get a value to subtract from the initial coefficient/weight, until we get to the smallest possible error (the bottom of the U-shaped curve of the loss function), and the best possible coefficient/weight value that got us there.
That was tough. No kidding. But here’s the intuition: FIP’s coefficients aren’t arbitrary, magical numbers. The 13 that accompanies the HR value in the FIP equation is rightly saying that home runs really tick your numbers up, and in defense, keeping numbers low is the name of the game (except strikeouts). Therefore, the number for strikeouts is far lower. The constant value comes from ERA minus the league average values for HR, BB, and K, plugged into the FIP equation. Again, that constant isn’t arbitrary magic, it’s just to scale FIP to look like ERA.
Full disclosure, my day job is as a data engineer on the data science team at my company, and I’ve taken several classes on Machine Learning in the Python programming language. I’ve dove a bit into statistics and linear algebra, and some calculus. Those are all buzzwords I’m not trying to blend in with, I promise. In fact, I dabbled my way into them via YouTube and the curiosity to know baseball better. I hope that disenchants the jargon. That’s what this article series hopes to do for advanced baseball statistics, overall. The math can become a bit more intuitive as we look at it together, seeing what’s really trying to speak from underneath the squiggles and Greek.
As a baseball fan, I hate walks, and home runs and strikeouts are the best part of watching the game. Fittingly, that’s what FIP is made of. When I watch a pitcher dazzle from the mound in a duel with another ace, especially as a hidden gem, buried beneath the bigger names or hidden behind the smaller numbers they’ve been stuck with from bad defense or winless teams, I remember that learning statistics like FIP isn’t just for the Sabermetrics court alchemists; it’s a way to see the biggest value for ourselves, hiding in plain sight.
Sources: